

Trying to make sense of today’s housing market can feel like putting together a puzzle with pieces that don’t quite match. One news report highlights declining home prices, while another points to continued growth. With so many different messages circulating, it’s understandable that homeowners and prospective buyers are unsure what to believe.
The reason for these conflicting reports is simpler than it might seem. Real estate markets don’t move in the same direction at the same time. What happens nationally may look very different from what’s happening in a particular city, neighborhood, or price range.
To understand where the housing market stands, it helps to look beyond the headlines and examine the factors influencing home prices.
Why Asking Prices Are Changing
One of the biggest sources of confusion comes from the difference between a home’s advertised price and its final selling price.
An asking price represents what a seller hopes to receive when putting a property on the market. It doesn’t necessarily reflect the amount a buyer will ultimately pay.
Recent housing data shows that sellers have been adjusting their expectations. According to HousingWire Data, the number of available homes has reached its highest level since November 2019. At the same time, mortgage rates have increased since spring, affecting affordability and contributing to longer selling timelines.
With more properties competing for buyers’ attention, sellers are becoming more deliberate about how they position their homes.
HousingWire Data reports that the national median asking price declined from approximately $449,000 in early August to $435,000 just two months later (see graph below):
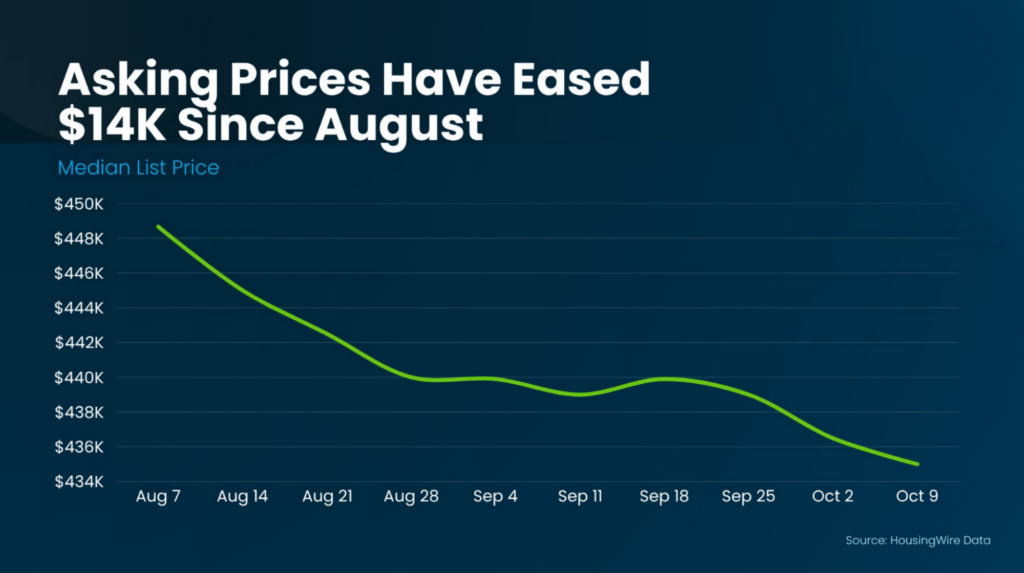
That represents a decrease of roughly 3%. While the number may seem significant at first glance, it doesn’t automatically indicate a weakening housing market.
Seasonal patterns are an important part of the explanation.
Housing activity typically slows as summer ends and fall begins. Families have settled into school routines, fewer people are actively searching, and sellers may need to adjust their prices to attract serious buyers.
Higher borrowing costs can also influence pricing decisions. When monthly mortgage payments become more expensive, buyers often have less flexibility in their budgets. Sellers who recognize these affordability challenges may choose a more competitive asking price rather than risk having their property sit on the market.
A lower asking price isn’t necessarily a sign of lost value. It can simply reflect a seller responding to current market conditions.
It’s also worth remembering that national asking price figures represent a broad collection of properties. They don’t tell you how much comparable homes in your neighborhood are actually selling for.
For a more meaningful picture, you need to examine recent local sales, available inventory, and how long similar properties are taking to sell.
Why Local Housing Markets Tell Different Stories
Real estate is influenced by local economic conditions, employment opportunities, population changes, housing supply, and buyer demand.
That means two cities can experience completely different pricing trends, even during the same period.
As Realtor.com explains:
“While national headlines might suggest a buyer’s market is taking hold, the reality on the ground depends heavily on where and what you’re trying to buy. Local trends can diverge sharply from national averages, especially when you factor in price range, property type, and post-pandemic market dynamics.”
Recent figures from the S&P Cotality Case-Shiller Index illustrate just how much these differences can matter.
Over a twelve month period, Chicago recorded home price growth of nearly 7%, while Seattle experienced a decline of approximately 1.6%.
That’s a difference of almost nine percentage points between two major metropolitan areas (see graph below):

These variations can have a direct impact on the decisions buyers and sellers make.
In a market such as New York, where annual price growth has approached 6%, homeowners may benefit from continued demand and relatively strong property values.
Meanwhile, buyers exploring markets such as Denver or Las Vegas may encounter different opportunities, including greater flexibility in negotiations or more choices among available properties.
Even within the same metropolitan area, market conditions can vary considerably. Entry level homes may attract strong competition while higher priced properties take longer to sell. One neighborhood may have limited inventory while another offers buyers a wider selection.
This is why relying exclusively on national housing reports can be misleading.
The most useful information isn’t simply whether home prices are rising or falling nationwide. It’s how comparable properties are performing in the specific market where you want to buy or sell.
Do Small Price Declines Signal a Bigger Problem?
Whenever home values begin to decline in certain areas, concerns about another major housing downturn tend to resurface.
However, modest price adjustments and widespread market crashes are very different situations.
Current figures show that even among major metropolitan markets experiencing annual price declines, the decreases are generally around 2% or less. Several other cities continue to report positive appreciation.
These changes are far smaller than the dramatic losses associated with the 2008 housing crisis.
Some markets also experienced unusually rapid price growth during the pandemic. As demand patterns shift and affordability becomes a greater consideration, those areas may see prices stabilize or retreat slightly from previous highs.
Rather than signaling an immediate nationwide crisis, these adjustments can be part of a broader transition toward more balanced market conditions.
Longer term housing data offers additional perspective.
According to the Federal Housing Finance Agency, national home prices have recorded year over year increases in every quarter since 2012.
Historical FHFA figures also demonstrate how property values have changed across several decades. Go back further, and a $100k home bought in 1991 would be worth about $436k today, even with the 2008 crash factored in (see graph below):

Of course, historical appreciation doesn’t guarantee that every property will increase in value or that prices cannot decline again.
Real estate markets move through cycles, and individual property performance depends on location, condition, demand, and broader economic circumstances.
Still, looking at several decades of housing data provides valuable context that short term headlines often leave out.
For homeowners, it reinforces the importance of evaluating real estate as a long term asset rather than focusing on every monthly price fluctuation.
For buyers, it highlights why affordability, financial readiness, and personal goals should play a larger role in purchasing decisions than attempts to predict the perfect moment to enter the market.
How Buyers and Sellers Can Use This Information
Understanding home price trends is most valuable when it helps you make informed decisions.
If you’re planning to sell, pay attention to what buyers are actually paying for properties similar to yours. Recent comparable sales, competing listings, and average days on market can help establish a realistic asking price.
Pricing a property appropriately from the beginning can improve its visibility, attract qualified buyers, and reduce the likelihood of repeated adjustments.
If you’re preparing to buy, evaluate more than the advertised price. Consider how long a home has been available, whether similar properties have recently sold above or below asking, and how much negotiating flexibility exists in your preferred area.
A changing market can create opportunities, but those opportunities aren’t always reflected in national statistics.
Working with a real estate professional who understands local inventory, pricing patterns, and buyer behavior can help you interpret the numbers and develop a strategy that fits your circumstances.
The Bottom Line
Housing headlines offer a snapshot of the bigger picture, but they rarely tell the complete story of an individual real estate market.
Asking prices may shift with the seasons, some cities may experience modest declines, and others may continue to appreciate. These trends can all happen simultaneously without contradicting one another.
Whether you’re considering purchasing a home, preparing to sell, or simply curious about your property’s current value, local market information provides a much stronger foundation for your decisions.
Thinking about your next move in North Texas? Let’s take a closer look at the housing trends in your area and discuss what they mean for your real estate goals.
Selling Soon | Vesta Schneider Real Estate
Looking For a New Home | Vesta Schneider Real Estate